Statistics on Angling in Japan
I assume that you know Japanese people are more active in fishing or angling compared to any other country in the world. But what is the actual situation?
In this article, I will try to explore the statistics around angling in Japan, and to reveal the current situation around angling. The view points to consider are; fishing population and its historical transition, analysis of current situation.
(And in the future article, I will discuss the future of angling in Japan.)
Fishing population
The fishing or angling population is continuously decreasing in Japan.
According to one of the governmental statistics, the 2021 fishing population is 6.4 million, in Japan (Basic Survey of Social Living.) Additionally, another survey (The White Paper on Leisure) is showing that the fishing population is 5.6 million, in the same year, 2021. We can consider that Japan has approximately 6 million leisure fishermans or anglers. Considering that the total population in Japan is 126 million, about 5% of people are engaging in fishing.
Now, let us go back to some data in the past years.
In the beginning of this millennium, According to the same survey done in 2001, it was 14.2 million. Then the total population was 127 million, to make the 11% were fishermans.
Around the year's so-called “bass fishing boom,” in the early to middle 1990’s. And then, the number of fishermen was nearly 20 million. So it means that 15 to 16% were fishermans, in Japan.
(note; the definition of the “fisherman/angler” in these surveys are “if you engage in fishing at least once in the last one year, you are counted as one.” Therefore, I assume this number is quite comparable to the angling statistics of western countries, based on the number of license sales.)
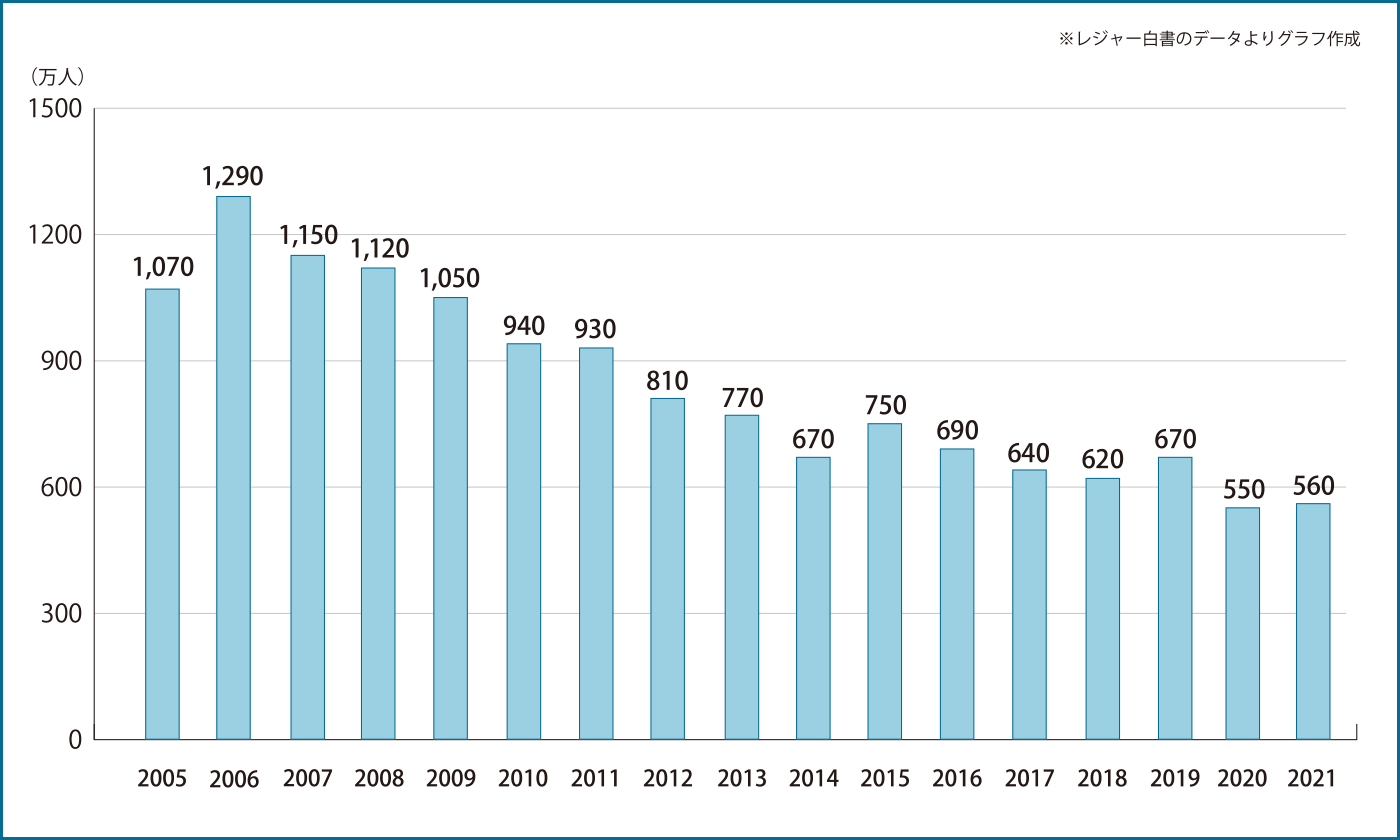
The White Paper on Leisure has been recording the fisherman population since 1984. And the graph below shows the change. One academic paper summarizes it with the percentage of fisherman population.
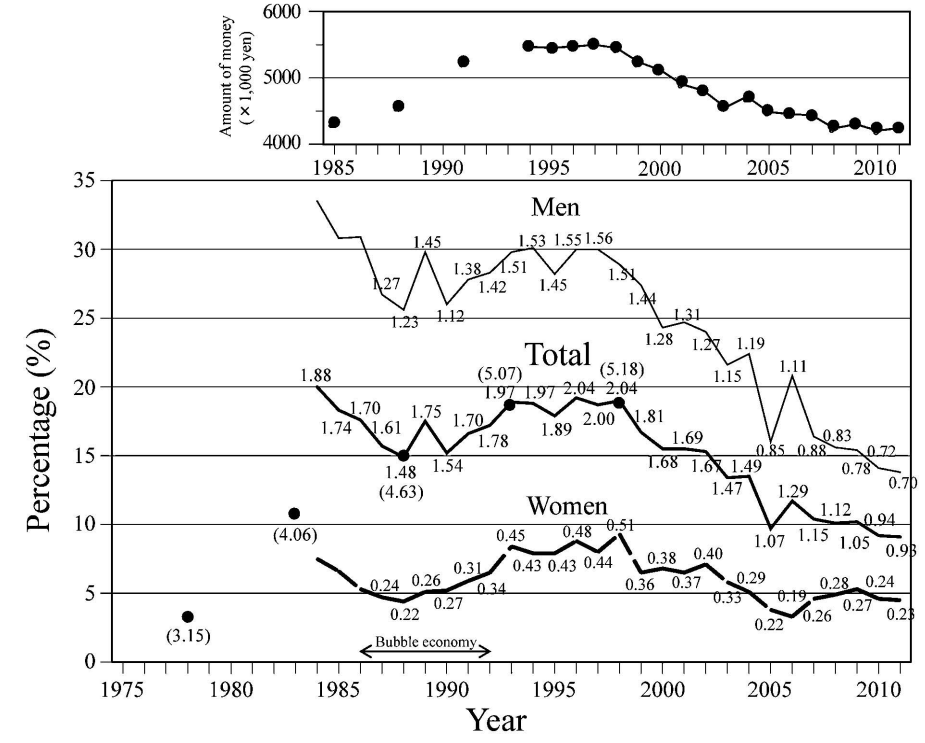
Surprisingly, in the early 1980's, it seems Japan had a much bigger fishing population. Then, it showed the increase around the babbling economy occurred between the late 1980’s and the early 1990’s. After this, it hit the record high population of nearly 20 million. However, this trend did not continue in the 21st century and then the grand trend is showing a steady decline in the fishing population.
Analysis, background of the transition of fishing population
Nakamura (2015) explained the change of population as that disposable income drove the change of the fisherman population.
These are his arguments. The years with high disposable income led to a larger fisherman population. The booming economy made more people interested in fishing, and it resulted in a high percentage of anglers until the middle of 1990’s (Nakamura (2015) showed an analysis on the relationship between interest in fishing and disposable income, as well.)
Additionally, he showed that the demographic tendency of this increase. In this booming period, the significant increase was gained by the male of 20 to 29 years old and the female below 39 years old. It made the following years keep high numbers of fishing population.
In 1998 and following years, the fisherman population turned its phase to declining. His analysis explained that this loss of population was from the decreased activity of males over 58 years old, and from the decreased disposable income.
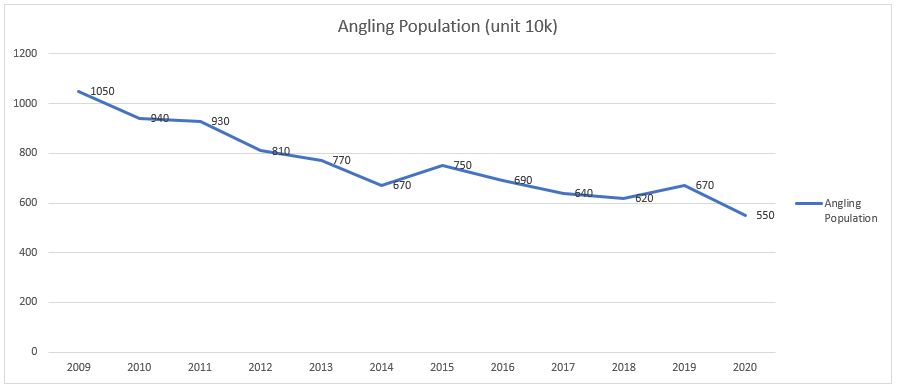
Following Nakamura (2015)’s analysis, I summarized the simple comparison between disposable income and the fisherman population. There has been no increase, or even continuous decrease of fisherman population since 2010, while disposable income has been low in the same period of time. It seems Nakamura’s point is supported by this data.
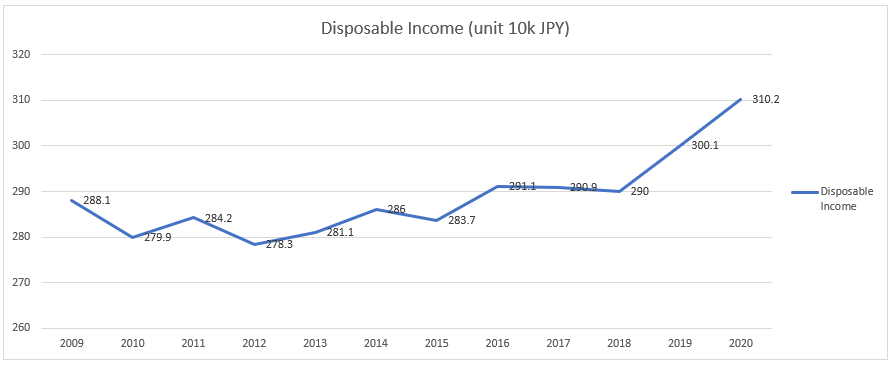
As we can see the increase of income after 2018 (at least, in numbers,) we may see the changes in the future. Hopefully, the change will be a positive one.
A brief comparison with other country
As we saw above, the current angling population is about 5%, in Japan.
Let me see other comparable countries.
To make the calculation simple, below angler % is calculated as the angler population divided by total population, while I understand that this percentage is often figured as the constituents out of active people (for example, excluding the population of children younger than 5 years old etc.)
The U.S. has 50.1 million anglers, in the total population of 331 million. Angling population is 15%. (Link to the source)
Australia has 4.2 million anglers in 26 million total population, hence 16% is the percentage of angler (Link to the source)
Italy has 2 million anglers in 59 million, and the angler population reaches 3%. (Link to the source)
England has 105.6 thousand anglers, in the total of 56 million. Angling population is 0.2%. (Link to the source)
Germany has 6.6 million anglers, while it has 83 million total population. It makes up the 6.6% angling population. (Link to the source)
France has 1.5 million anglers, and out of 68 million people, has 2% of the angling population. (Link to the source)
The United States and Australia are very active countries for angling. In these countries, fishing is one of the popular options in their leisure activity alternatives. While other European countries listed have relatively lower figures.
Coming back to Japan, it has 5%. Despite the intuition that Japan should have a much higher percentage of angler population, these statistics are not supporting it.
Japan’s current state
As we saw above, Japan had a period of fishing boom, and it increased the fisherman population. After this period, the angling population is in the decreasing trend.
Then, who is going fishing in Japan now?
White Paper on Leisure is summarizing the percentages by age groups, in a given activity. In fishing, the result is as below.
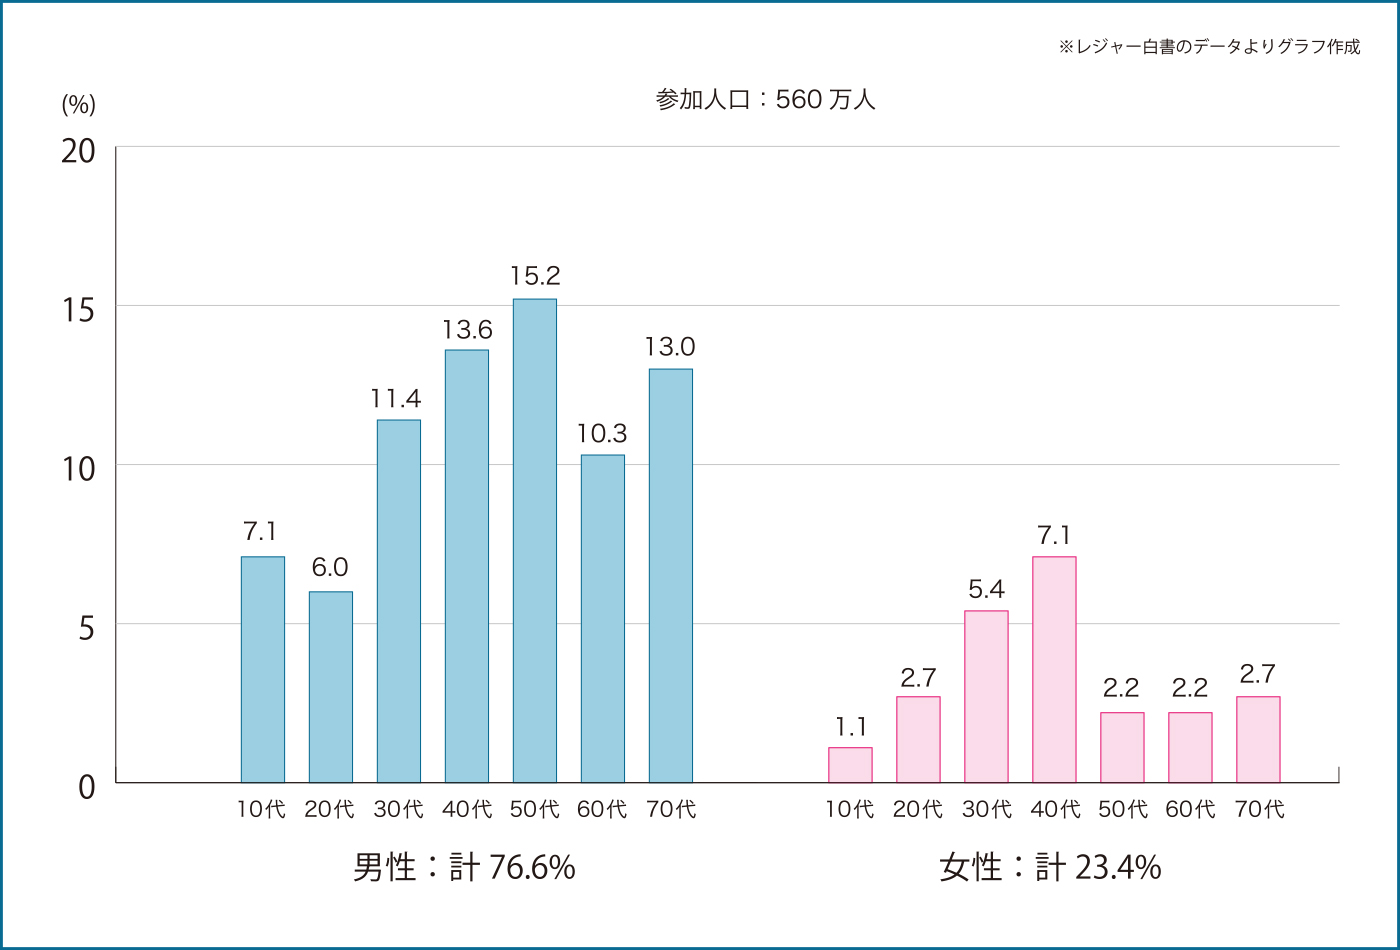
Out of total anglers, 76.6% is male and 23.4% is female. Each bar is showing the age group. In the male, 50’s is taking the biggest part of 15.2 %, and 40’s is following with 13.6 %. These top two age groups are the same in females, too.
These age groups contain the people who had experienced fishing in the time of the fishing boom period. During this period, the current 40’s and 50’s were teenagers or in their 20’s. It is considered that these people came back to fishing, under the covid affected time when the leisure were limited to certain outdoor activities including fishing.
On the other perspective, there are low percentages in teens and 20’s. This easily reminds us of the situation in the future of Japanese fishing; decrease of fishing population.
These tough facts urges me to think about the action we have to take.
These actions will be discussed in future articles of mine… To be continued.
5 thoughts on “Statistics on Angling in Japan”